OI Volume Oscillator Cross DynamicsThe OI Volume Oscillator Cross Dynamics is a custom indicator designed to analyze the relationship between Open Interest (OI) and Volume Oscillator in the cryptocurrency markets. This tool aims to assist traders in identifying potential market sentiment shifts, enabling them to make informed trading decisions based on the dynamic interplay of these key market components.
Key Components:
Open Interest (OI): This component represents the total number of outstanding derivative contracts, such as futures and options, that have not been settled. Open Interest provides insights into market participation and trader commitment, offering a broader perspective on the flow of money into the market.
Volume Oscillator: The Volume Oscillator is a momentum indicator that showcases the difference between two volume moving averages. It is instrumental in identifying bullish or bearish market trends by providing insights into buying and selling pressure in the market.
Functional Dynamics:
Crossover Analysis: The indicator identifies points where the Volume Oscillator crosses above or below the Open Interest, marking potential shifts in market sentiment. These crossover points are visually represented, making them easily identifiable for analysis.
Visual Cues: The indicator uses visual shapes and colors to enhance interpretability. Bullish crossovers are marked with green upward triangles, while bearish crossovers are represented by red downward triangles.
Customization: The indicator allows for customization of the Volume Oscillator’s sensitivity through a multiplier, enabling traders to adjust the indicator according to their trading strategy and market outlook.
Usage Guidelines:
Bullish Scenario: A crossover of the Volume Oscillator above the Open Interest is interpreted as a bullish signal, indicating potential upward price movement due to increased buying pressure or trading activity.
Bearish Scenario: A crossover of the Volume Oscillator below the Open Interest is seen as a bearish signal, suggesting potential downward price movement due to increased selling pressure or reduced trading activity.
Conclusion:
The OI Volume Oscillator Cross Dynamics indicator is designed to provide traders with a nuanced perspective of market activity through the combined analysis of Open Interest and Volume Oscillator. Its design aims to offer valuable insights, allowing for a strategic approach to trading based on the observed market dynamics.
The code is open source and utilizes Binance info but you can alter the code to meet your needs to go beyond just Bitcoin if needed.
Search in scripts for "open interest"

Crypto Leverage Ratio [Market Cap / Open Interest in %]This indicator calculates what percentage of market cap data corresponds to open interest data.
Leverage Ratio = 1/(Market Cap / 100 * Open Interest)
Market Cap data comes from TradingView -> CRYPTOCAP:YOURCOINSYMBOL
Open Interest data comes from IntoTheBlock -> INTOTHEBLOCK:YOURCOINSYMBOL_PERPETUALOPENINTEREST
IntoTheBlock refresh perpetual data at the end of the day. It means there is no intraday data.
It can only be used in Daily or higher time intervals.
This indicator and any other indicator can not precisely calculate real leverage ratio except exchanges itself. This calculation is just based on assumption.
You can see the exact same result by just adding:
1/(CRYPTOCAP:BTC/100*INTOTHEBLOCK:BTC_PERPETUALOPENINTEREST)
to your symbol search, if your chart is a BTC chart.
"
The Futures Open Interest Leverage Ratio is calculated by dividing the market open contract value, by the market cap of the asset (presented as %). This returns an estimate of the degree of leverage that exists relative to market size as a gauge for whether derivatives markets are a source of deleveraging risk.
High Values indicate that futures market open interest is large relative to the market size. This increases the risk of a short/long squeeze, deleveraging event, or liquidation cascade.
Low Values indicate that futures market open interest is small relative to the market size. This is generally coincident with a lower risk of derivative led forced buying/selling and volatility.
Deleveraging Events such as short/long squeezes, or liquidation cascades can be identified by rapid declines in OI relative to market cap, and vertical drops in the metric.
-glassnode
"
says glassnode. I think it is more than that. Especially with MAs.

Volume CVD and Open InterestVolume, Cumulative Delta Volume and Open Interest are great indications of strength and sentiment in the market. Until now they have required separate indicators, but this indicator can show them all.
With a clean and aesthetic plot, this indicator has the option to choose the data source:
- Volume - the total volume of transactions, buys and sells
- Up Volume - the total volume from buys only
- Down Volume - the total volume from sells only
- Up/Down Volume (Net) - the difference in the Buy Volume and Sell Volume
- Cumulative Delta - the sum of the up/down volume for the previous 14 bars
- Cumulative Delta EMA - a smoothed average of the sum of the up/down volume for the previous 14 bars, over a 14 period EMA
- Open Interest - a user defined ticker, whose value is added to the plot, while this is designed to be used with Open Interest tickers, you can actually choose any ticker you want, perhaps you want to see DXY while charting Bitcoin!
There are several customization features for the colour of the plot, with a nice gradient colouring from high to low. You can choose the lookback which defines only the highest and lowest values for the colour gradient. There is also an option for how the Open Interest value is determined, based on Close, Open or differences between previous values.
While similar, Volume and Open Interest are not the same. To me the simplest explanation is Volume shows the trades that have been executed and the buy/sell direction, while Open Interest shows the value of open trades that are yet to be completed.
Volume shows strength, sentiment and volatility.
Open Interest does not show direction, but does indicate momentum and liquidity in the market.

Binance Big Open Interest Delta Change v2 Note: This script will only work properly with Binance Futures symbols.
This script simply looks at the open interest for the symbol you are currently viewing and determines if a large change in open interest has occurred, which triggers a background color alert.
It does this by comparing the absolute value of the range of the current open interest bar with a simple average (length set by user) of the past x range. The user also determines what is considered a 'large' change in open interest by setting a multiplier with which the current range must exceed compared to the average range in order to trigger an alert.
If the change in open interest is an increase in OI, the alert is blue, and if the change in open interest is a decrease, the alert is orange.
The open interest ticker that is used for calculation is derived by adding the current ticker and "_OI" so that it auto changes each time you switch to a new Binance futures contract.

Binance Open InterestIntro
A free and open source indicator that shows you open interest for Binance USDT and coin margin perpetual swap contracts, plotted as candlesticks.
Open interest means the total number of outstanding derivatives contracts, or in plain and simple English: the total amount of positions that traders have opened and still remain open.
Instructions
I've included data for a variety of cryptocurrencies that are quite popular right now.
However, since it's open source you can of course add any coin you want.
It's important to know that coin margin contracts have their open interest denominated in USD.
So if, for example, the ETH/USD perp shows a value of 470 million, that means 470 mil USD.
Tether margin contracts on the other hand are denominated in the coin itself.
So if, for example, the SOL/USDT perp shows a value of 1 million, that means 1 mil SOL worth of open contracts.
This is how the exchange created and denominated the contracts and I kept it this way to keep the data clean.
You could multiply that 1 mil SOL by the SOL price and it would show you the total open interest in USD terms of course, but that would make the candles look a bit funky.
If you look at the code you can see that for the coin margin contracts I've multiplied BTC open interest by a 100 and for altcoins I multiplied it by 10.
This is because of the Binance contract specifications, they use a multiplier of a 100 for bitcoin and altcoins have a multiplier of 10.
If you google "Binance Trading Rules of coin-margined Contracts" you'll find this info.
Some coins only have a USDT margin perp and not a coin margin perp.
YFI for example doesn't have a coin margin perp, but it is included in the list.
So if you select YFI and choose "coin margin" the indicator won't show anything.
The indicator still works, just select a different contract and you'll see open interest data appear again.
Access
It's free so just favourite it and you'll be able to add it to your chart and use it.
And it's also open source so you could just copy the code and make your own version of it.
Cheers.

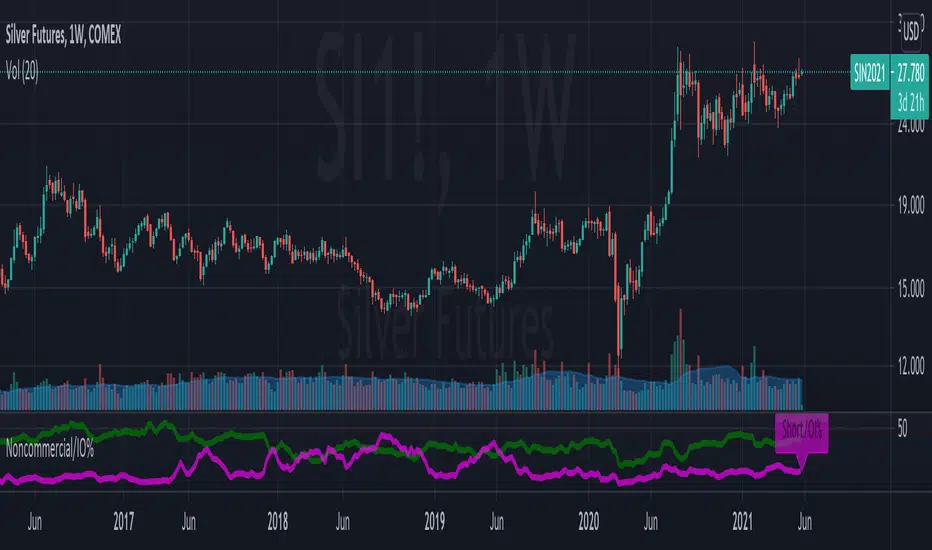
Noncommercial long futures position to overall Open InterestThis is an indicator that gets data from Quandl and presents weekly CFTC futures data (www.cftc.gov). In this indicator, the noncommercial long/short positions are calculated as a percentage of overall Open Interest. This indicates the bullish/bearish sentiment of the market.
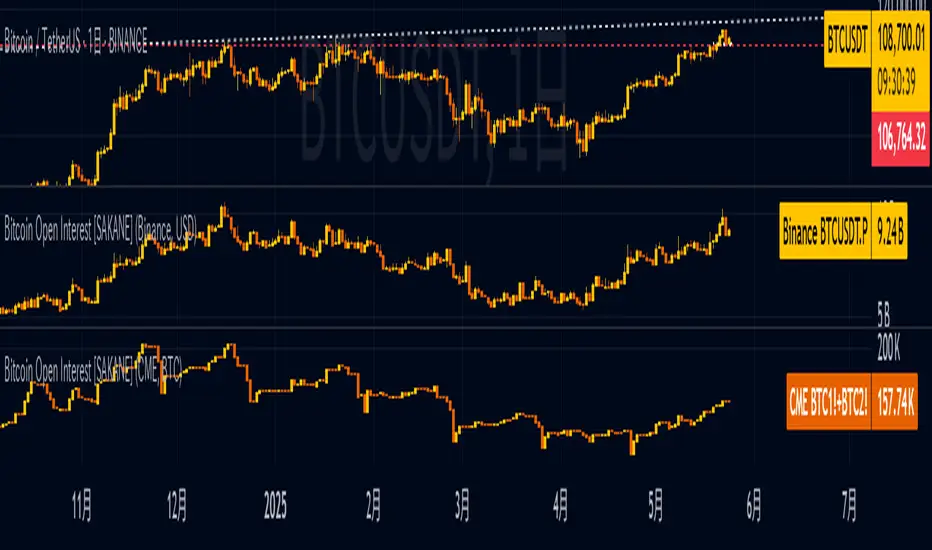
Bitcoin Open Interest [SAKANE]Bitcoin Open Interest
— Unveiling the True Flow of Capital
PurposeVisualize and compare Bitcoin open interest (OI) from CME and Binance, the leading derivatives exchanges, in a single intuitive chart, providing traders with clear insights into crypto market capital dynamics.
Background & MotivationIn the 24/7 crypto market, price movements alone reveal only part of the story. Open interest (OI)—the total outstanding futures contracts—offers critical clues to the market’s next move. Yet, accessing and interpreting OI data is challenging:
CME Constraints: Commitment of Traders (COT) reports are weekly, and standalone BTC1! or BTC2! OI is noisy due to contract rollovers, obscuring true OI changes.
Existing Tool Limitations: Most OI indicators are fixed to either USD or BTC, limiting flexible analysis.
This indicator overcomes these hurdles, enabling seamless comparison of CME and Binance OI to track the market’s “capital center of gravity” in real time.
Key Features
Synthetic CME OI: Combines BTC1! and BTC2! to deliver high-accuracy OI, eliminating rollover noise.
Multi-Timeframe Analysis: Displays daily CME OI as pseudo-candlestick (OHLC) on any timeframe (e.g., 4H), allowing intuitive capital flow tracking across timeframes.
CME/Binance One-Click Toggle: Instantly compare institutional-driven CME and retail-driven Binance OI.
USD/BTC Flexibility: Switch between BTC (real demand) and USD (margin) perspectives for OI analysis.
Robust Design: Concise, global-scope code ensures stability and adaptability to TradingView updates.
Insights & Use Cases
Holistic Market Sentiment: Analyze capital flows by region and exchange for a multidimensional view.
Signal Detection: E.g., a sharp drop in CME OI during a sell-off may signal institutional withdrawal.
Retail Trends: A surge in Binance OI suggests retail-driven inflows.
Event-Driven Insights: E.g., during a hypothetical April 2025 “Trump Tariff Shock,” instantly identify which exchange drives capital shifts.
Unique ValueUnlike price-centric indicators, this tool focuses on capital flow (OI). It’s the only indicator offering one-click multi-timeframe and multi-exchange OI comparison, empowering traders to uncover the market’s “true intent” and gain a strategic edge.
ConclusionBitcoin Open Interest makes the market’s hidden capital movements accessible to all. By capturing market dynamics and pinpointing the “leading forces” during events, it sets a new standard for traders seeking a revolutionary perspective.
[Nekonyam] Auto Select Currency Binance Open InterestDisplays open interest in crypto currencies.
It automatically changes the open interest displayed according to the virtual currency displayed on the chart.
It works even if you are viewing an exchange other than Binance.
It shows open interest according to the base currency, so it works with BTCEUR and other currencies.
ETHBTC, for example, shows the open interest in ETH.
If you are viewing a currency that does not provide open interest from Binance to TradingView, it will not work.
It will not work if ETFs, CME futures, etc. are displayed. (such as GBTC or BTC1!)
仮想通貨のオープンインタレストを表示します。
チャートに表示している仮想通貨に合わせて自動で表示するオープンインタレストを変えます。
バイナンス以外の取引所を表示していても使えます。
ベース通貨に合わせてオープンインタレストを表示しているので、BTCEURなどでも使えます。
ETHBTCなどはETHのオープンインタレストが表示されます。
BinanceからTradingViewにオープンインタレストが提供されていない通貨を表示している場合は使えません。
ETFやCME先物などを表示している場合は使えません。(GBTCやBTC1!など)

Hunt Bitcoin CoT Open Interest DeltaWhy Bother another CoT signal?
Its different & focused on the Insider's.
Performance -
This Indicator provided a
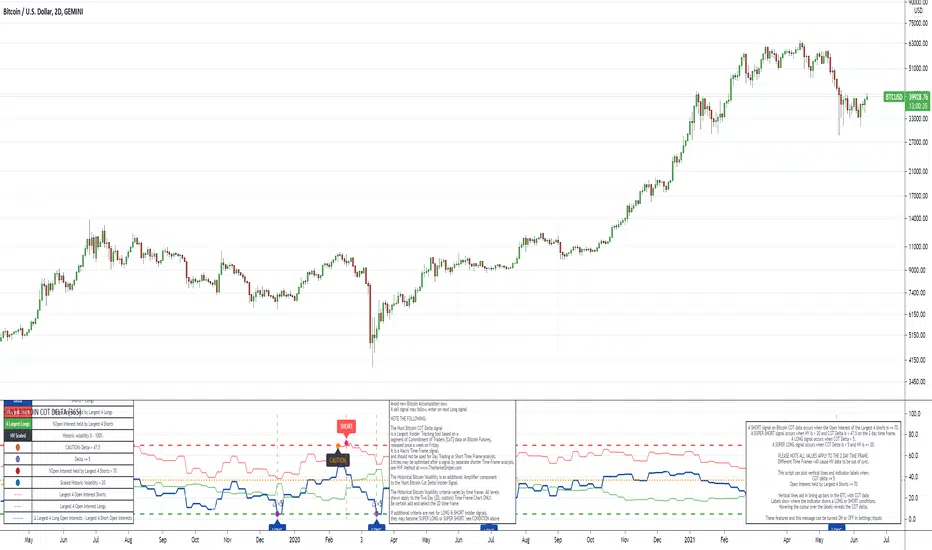
1. Signal 1 = 26th March 2019 = SUPER LONG at $4,500 that saw a near $14,000 run up
2. Signal 2 = 18th & 24th June 2019 = SHORT at the second & final level $11,700 after repeated attempts & failure in the $13K range, the mini Echo Bitcoin Bull of 2019
3. Signal 3 = 17th December 2019 = LONG $6,900, Bitcoin rallied to Mid $10,500's
4. Signal 4 = 18th Feb 2020 = SUPER SHORT from $9,700's to a final extreme Low of $3,000, calling the CV-19 collapse
5. Signal 5 = 17th March 2020 = LONG from $5,400 no closure point yet
6. Signal 6 = 29th June 2020 = SUPER LONG reiterate from $10,700 no closure sell signal yet
7. Signal 7 = 17th May 2020 = LONG another accumulate LONG with no sell signal yet generated at Post H&S's low of $33,000
Note - This indicator only commences March 2019, as Bitcoin futures were a recent introduction and needed to settle for 6 months in both use and data, no signals were meaningful prior & data was light.
What is Provided. - Please note the need to also add the Hunt Bitcoin Historical Volatility Indicator for full understanding.
We provide 3 things with the 3 indicators.
'Insider' indications from Largest players in the futures market.
1. Bitcoin Macro Buy Signals.
a) The Bitcoin Commitment of Traders results see us focus solely on Largest 4 Short Open Interest & Largest 4 Long Open Interest aspects of the CoT Release data.
When the difference - is tight, a kind of pinch, these have been great Buy signals in Bitcoin.
We call this difference the Delta & When Delta is 5% or less Bitcoin is a Buy.
2. Bitcoin Macro Sells.
a) A sell signal is Triggered in Bitcoin at any point the Largest 4 short OI > or = to 70
3. AMPLIFIER Trade signals 'Super' Longs or Shorts -
Extreme low volatility events leads to highly impulsive & volatile subsequent moves, if either of 1 or 2 above occur, combined with extreme low volatility
a 'Super Long' or 'SUPER SELL' is generated. In the case of the short side, given Bitcoins general expansive and MACRO Bull trend since inception, we seek an additional component
that is an extreme differential/Delta reading between 4 biggest Longs & Shorts OI.
Namely CoT Delta also must be > 47.5%
We also have a Cautionary level, where it is not necessarily a good idea to accumulate Bitcon, as a better opportunity lower may avail itself, see conditions below.
So the required logic explicitly stated below for all Signals.
1. Long - Hunt Bitcoin CoT Delta < or = 5
2. SUPER Long - Hunt Bitcoin CoT Delta < or = 5; and 2 Day Historical Bitcoin Volatility = or < 20
3. Short - Largest 4 Sellers OI = or > 70
4. SUPER Short - Largest 4 Sellers OI = or > 70; AND..
Hunt Bitcoin CoT Delta = or > 47.5 AND 2 Day Historical BTC Volatility = or < 20
5. Caution - Largest 4 Sellers OI = or > 67.5 AND Hunt Bitcoin CoT Delta = or > 45
WARNING SEE Notes Below
Note 1 - = Largest 4 Open Interest Shorts
Note 2 - = Largest 4 Open Interest Longs
Note 3 - = Hunt Cot Delta = (Largest 4 sellers OI) -( Largest 4 Buyers OI)
Caution = Avoid new Bitcoin Accumulation Right Now, A sell signal might follow Enter on next Long
Note 4 - The Hunt Bitcoin COT Delta signal is a Largest 'Insider' Tracking tool based on a segment of Commitment of Traders data on Bitcoin Futures, released once a week on a Friday.
It is a Macro Timeframe signal , and should not be used for Day trading and Short Timeframe analysis , Entries may be optimised after a Hunt Bitcoin CoT Signal is generated by separate shorter Timeframe analysis.
Note 5 - The Historical Bitcoin Volatility is an additional 'Amplifier' component to the 'Hunt Bitcoin Cot Delta' Insider Signal
Note 6 - The Historical Bitcoin Volatility criteria varies by timeframe, the above levels are those applying on a Two Day TF Chart, select this custom timeframe in Trading View.
if additional criteria are met for LONG & SHORT insider signals, they may become 'Super Longs/Shorts', see conditions box above.
Aggregated Open Interest Multi-Exchange (USD)This indicator aggregates Open Interest (OI) data from multiple major cryptocurrency exchanges into a single unified view in USD, using data available on TradingView. It automatically adapts to the asset you're viewing on the chart.
Features:
Aggregates OI from 7 major exchanges: Binance, Bybit, OKX, Bitget, Deribit, HTX, and Coinbase
All values converted to USD - unlike native OI which shows contracts/coins
Uses only data available on TradingView platform
Automatically detects the asset from your chart (BTC, ETH, SOL, etc.)
True apples-to-apples comparison across exchanges
Displays as candlesticks showing OI open, high, low, and close
Toggle exchanges on/off individually
Handles different contract types per exchange automatically
Why USD conversion matters:
Traditional OI indicators show values in contracts or crypto units, making it difficult to compare across exchanges. This indicator converts everything to USD, giving you the real dollar value of open positions across all exchanges.
How it works:
Simply add the indicator to any crypto perpetual futures chart. It will automatically fetch and aggregate OI data from all supported exchanges for that asset using TradingView's built-in data feeds, converting everything to USD.
Supported Exchanges:
Binance, Bybit, Bitget, HTX: USDT perpetuals
Deribit: BTC/ETH use USD contracts, others use USDC
OKX: Contract-based (automatically converted)
Coinbase: USDC perpetuals
Perfect for traders who want a comprehensive view of total market Open Interest in USD across exchanges using reliable TradingView data.

Volume / Open Interest "Footprint" - By LeviathanThis script generates a footprint-style bar (profile) based on the aggregated volume or open interest data within your chart's visible range. You can choose from three different heatmap visualizations: Volume Delta/OI Delta, Total Volume/Total OI, and Buy vs. Sell Volume/OI Increase vs. Decrease.
How to use the indicator:
1. Add it to your chart.
2. The script will use your chart's visible range and generate a footprint bar on the right side of the screen. You can move left/right, zoom in/zoom out, and the bar's data will be updated automatically.
Settings:
- Source: This input lets you choose the data that will be displayed in the footprint bar.
- Resolution: Resolution is the number of rows displayed in a bar. Increasing it will provide more granular data, and vice versa. You might need to decrease the resolution when viewing larger ranges.
- Type: Choose between 3 types of visualization: Total (Total Volume or Total Open Interest increase), UP/DOWN (Buy Volume vs Sell Volume or OI Increase vs OI Decrease), and Delta (Buy Volume - Sell Volume or OI Increase - OI Decrease).
- Positive Delta Levels: This function will draw boxes (levels) where Delta is positive. These levels can serve as significant points of interest, S/R, targets, etc., because they mark the zones where there was an increase in buy pressure/position opening.
- Volume Aggregation: You can aggregate volume data from 8 different sources. Make sure to check if volume data is reported in base or quote currency and turn on the RQC (Reported in Quote Currency) function accordingly.
- Other settings mostly include appearance inputs. Read the tooltips for more info.

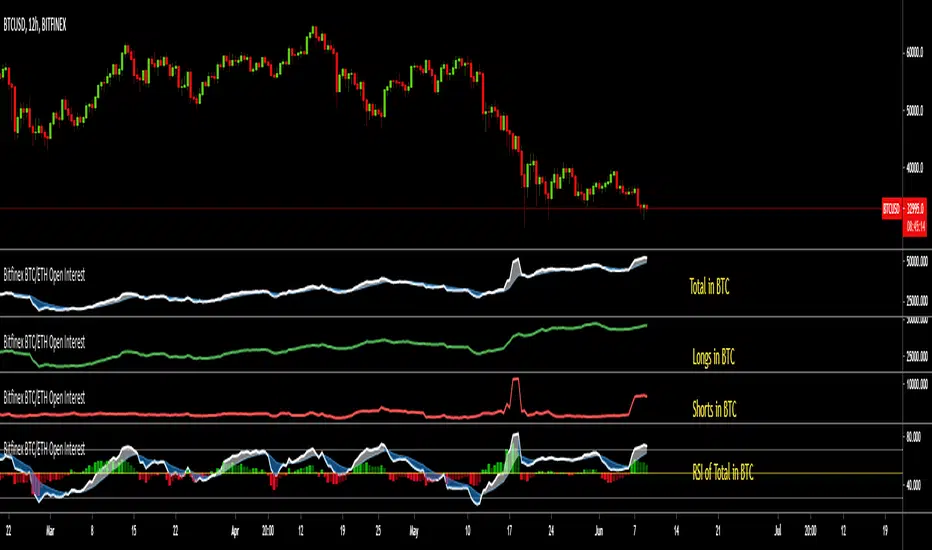
Bitfinex BTC/ETH Open InterestThe Bitfinex Exchange is providing the Open Long and Short positions as data feeds in Tradingview. This information can be valuable in order to judge how the big players are positioned.
This indicator allows to analyze this Bitfinex Open Interest data for BTC and ETH. By default it shows the Total Open Interest (Longs + Shorts) in BTC. A 10 period EMA is applied to the data.
The following alternative displays are available:
- Show ETH instead of BTC
- Show Long positions separately
- Show Short Positions separately
- Show the results in USD (Number of coins multiplied by period closing price)
- Show RSI instead of absolute value (see below)
Instead of displaying the absolute value, it is possible to show the RSI (current default length is 20) to make the changes easier visible. If RSI display is selected, then the Overbought, Oversold and Middle Line are shown automatically. Additionally a histogram is displayed which shows the difference between the RSI and the EMA of the RSI.
Crypto Open InterestPlots a crypto's open interest on Binance.
You can choose to see OI as asset-denominated (e.g. 1000 BTC), USD-denominated, or both.
How I usually interpret OI:
Price up, OI up = longs opened = bullish
Price up, OI down = shorts closed = bullish on HTF, or counter-trade on LTF
Price down, OI up = shorted opened = bearish
Price down, OI down = longs closed = bearish on HTF, or counter-trade on LTF
I find the indicator useful on 1-minute charts to identify liquidations and compare perp v.s. spot patterns.

CoT Absolute Percent-Buschi
English
I'm often asked to provide an alternate view on the CoT data. For example, the indicator "Commercial index" is an oscillator from 0 to 100, but oftentimes it can be helpful to look at the absolute position. So, here the absolute position of certain parts of the CoT report are given, alongside with the percentage of a given time frame to put them in place.
The inputs are:
CoT Part Number ('1' for Commercials Short, '2' for Commercials Long, '3' for Commercials Netto, '4' for Large Speculators Short, '5' for Large Speculators Long, '6' for Large Speculators Netto, '7' for Small Speculators Short, '8' for Small Speculators Long, '9' for Small Speculators Netto, '10' for Open Interest)
Review Period (in years, just used for the percentage)
Percent Line 1, 2, 3, 4 (just to provide some lines which can be altered as required)
DISCLAIMER: I'm aware of Pine Script's ability to provide options as inputs (which would be much nicer for the CoT Parts). Alas, it is only available since version 3, and I noticed that for some reason the CoT data is not correctly adjusted to last Tuesday when using higher versions than 1. If someone knows a solution, please contact me.
Deutsch
Ich werde oft gefragt, eine alternative Sicht auf die CoT-Daten zu geben. Der Indikator "Commercial Index" zum Beispiel schwankt als Oszillator zwischen 0 und 100, aber oft kann der Blick auf die absolute Positionierung hilfreich sein. Also werden hier die Absolutpositionen verschiedene CoT-Bestandteile wiedergegeben, zusammen mit einer prozentualen Einteilung über eine vorgegebene Zeitspanne, um sie einordnen zu können.
The Eingaben lauten:
CoT Part Number ('1' Commercials Short, '2' Commercials Long, '3' Commercials Netto, '4' Large Speculators Short, '5' Large Speculators Long, '6' Large Speculators Netto, '7' Snall Speculators Short, '8' Small Speculators Long, '9' Small Speculators Netto, '10' Open Interest)
Review Period (Zeitintervall in Jahren, um die Prozentlinien zeichnen zu können)
Percent Line 1, 2, 3, 4 (um die Prozentlinien zur Verfügung zu stellen, die dann beliebig geändert werden können)
DISCLAIMER: Ich weiß über die Möglichkeit Bescheid, ab Pine Script Version 3 Optionen als Eingaben benutzen zu können (was deutlich angenehmer für die CoT-Bestandteile wäre). Leider habe ich gemerkt, dass die CoT-Daten bei Versionen über 1 leider nicht korrekt auf letzten Dienstag adjustiert werden, keine Ahnung warum. Falls jemand eine Lösung kennt, bitte kontaktieren.

Commercial / Open Interest-Buschi
English:
Another view the Commitment of Traders (CoT) data
Since the Commercials are often a good indicator for future market movements, I tampered a little bit with their positioning (long or short) in relation to the open interest to visualize some kind of "commercial buying (long) or selling (short) power". It's definitely nothing more than work in progress, but I decided to publish it anyway. Critical comments are mostly welcome.
Deutsch:
Ein weiterer Blick auf die Commitment of Traders (CoT) Daten
Da die Commercials häufig ein guter Indikator für zukünftige Marktbewegungen sind, habe ich ein wenig mit ihrer Positionierung (long oder short) im Verhältnis zum Open Interest herumgebastelt, um eine Art von "kommerzieller Kauf- (long) oder Verkaufs-Kraft" abzubilden. Es ist momentan noch im absoluten Teststadium, aber ich habe mich dazu entschlossen, es trotzdem zu veröffentlichen. Kritische Anmerkungen sind sehr willkommen.

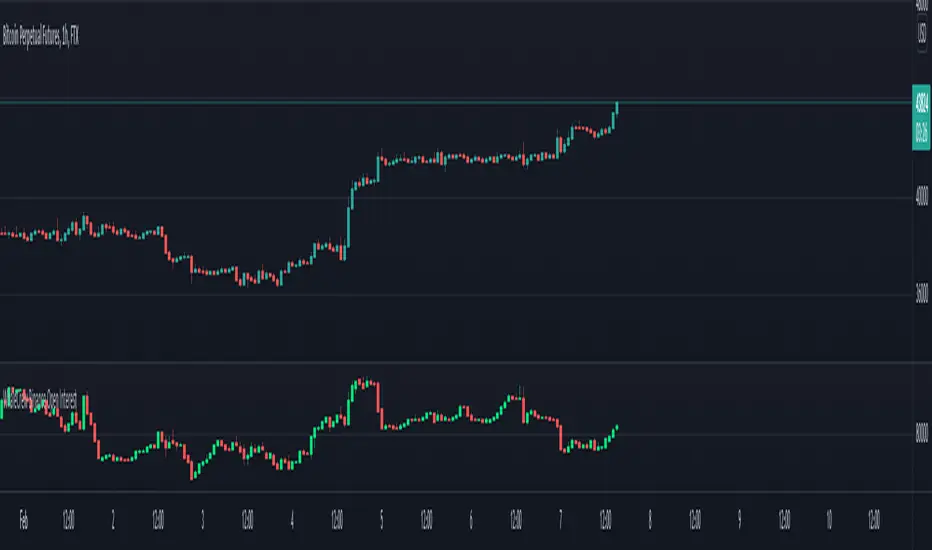
Aggregated Perpetual Futures Open InterestPurpose
Aggregates perpetual futures open interest across Binance, Bybit, and OKX for the base currency of the asset loaded in your tradingview window.
How It Works
Symbol detection: The script grabs syminfo.basecurrency (e.g., “BTC”) from whatever market is on screen.
Ticker mapping: It constructs the three perp-OI feeds that TradingView publishes in the form EXCHANGE:USDT.P_OI
Data request: For each feed it fetches the full OHLC candle (request.security) on the chart’s timeframe. If a venue doesn’t list that perp, the request simply returns na.
Aggregation: The script adds the opens, highs, lows, and closes of all non-na feeds to produce a single aggregated OI candle.
General Notes
The status line shows each venue’s individual OI close.
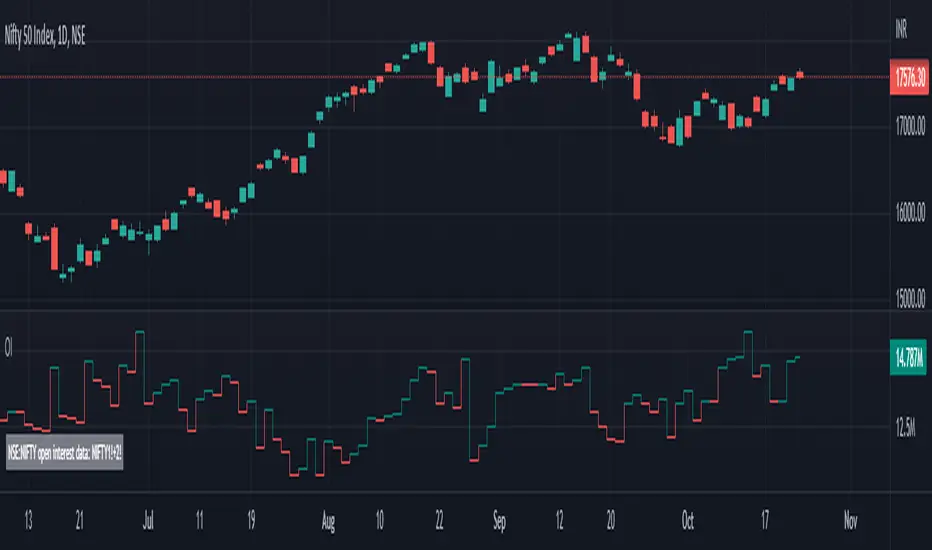
ILM NSE Futures - Open Interest Analysis - FnOUse this indicator on Daily Timeframe
This script works only on India NSE Futures (Indices and Fno Stocks)
This script pulls Stock/Index Price/Volume Info + Futures Current/Next Price/Volume/Open Interest Info
Calculates the Combined OI and identifies the OI Buildup based on the Price Change and color codes the info for easy reading
This script also calculates Stock/Futures Volume action to identify if big players are aggressively trading in Futures
Also OI Buildup to Future Volume is calculated to track the presence of big players.
Summary Row is displayed at the bottom which shows Futures Premium/Discount to Index/Stock

NSE Open Interest Current + Future Month - OI - COIUse this indicator on Daily Timeframe
This script enhances the standard Open Interest indicator in the following ways
Pulls Current Month and Next Month OI and sums up the data - COI
Works even if input symbol is stock/index and appends Current and Future suffix to pull the data
WhaleCrew Crypto Open InterestUse Crypto Open Interest Data available on TradingView to your advantage.
Features
Auto-Detect Symbol (based on chart)
Preset Symbols (BTC, ETH, BNB, XRP, LUNA, ADA, SOL, AVAX and DOT)
Exchanges ( Binance and BitMex )
Inverse and USDT Pairs
Override Data Option to use any OI Data on TradingView
Customizable Candles

WhaleCrew Binance Open InterestShows Open Interest of ANY Binance pair (BTCUSD, ETHUSD, ADAUSD, ...).
Inverse and USDT pairs
Preset-Pairs (BTC, ETH, XRP, ADA, SOL, DOT, ...)
Custom Candle Colors (candles can be turned off)
Deckchair Trader COT Open InterestPlots the COT Open Interest from the legacy report data from Quandl. Plots the commercial, non commercial and non reportables. Each plot can be hidden as needed.
I've tried to capture the basic dollar based currencies and the futures such as corn , wheat , rice, oil , hogs etc. The symbols required a little translation to match what Quandl is expecting but I think I got most of them. Please let me know of any issues with these.
Part of a suite of COT related indicators based on the excellent book "the commitment of traders bible" by Stephen Briese.
Works best on weekly timeframe.
Feb 26, 2018
Release Notes: Quandl have changed their codes :( now they seem to be using the CFTC Id's where are numeric (and can be found in the dump you get from them)
So whereas before for example, GBPUSD was mapped to BP it is now mapped to 096742.
I have gone through the various dumps and tried to map all the symbols I was using, the currency were the easy ones, the wheat, corn etc a little harder to trade down due to variations.
Please let me know if different
Thanks
Tim Titchmarsh
DeckchairTrader

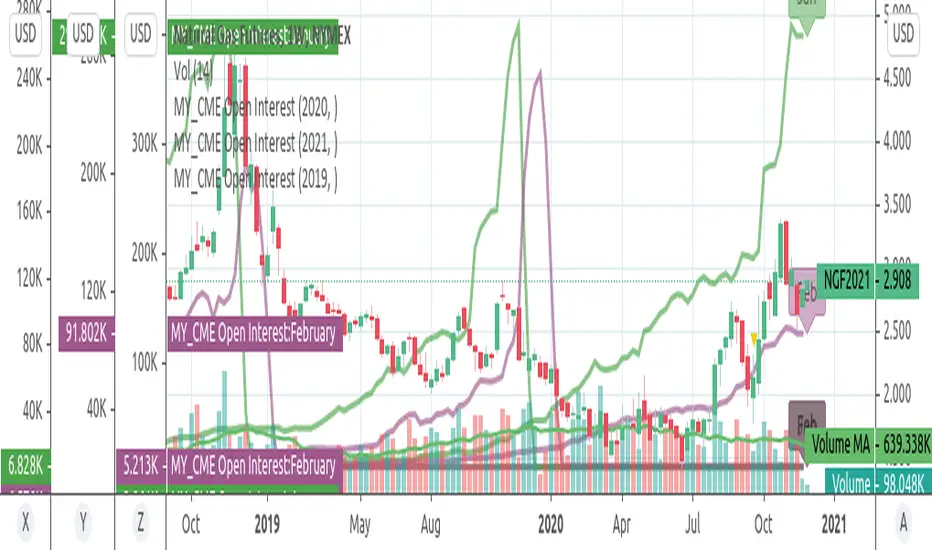
MY_CME Open Interestend-of-day Open Interest as provided by CME for D interval.
Can select Commodity (Gold.Silver,Crude), year, contract (Feb,April,June,AugOct,Dec)